
Published June 26th, 2026.
The Virginia Task Force on Primary Care is an initiative of the Virginia Center for Health Innovation and is funded by the Virginia Department of Health. The Research Consortium at VCHI developed the following report on behalf of the Task Force and is intended to support data-informed strategies to strengthen and sustain primary care in the Commonwealth.
Contents
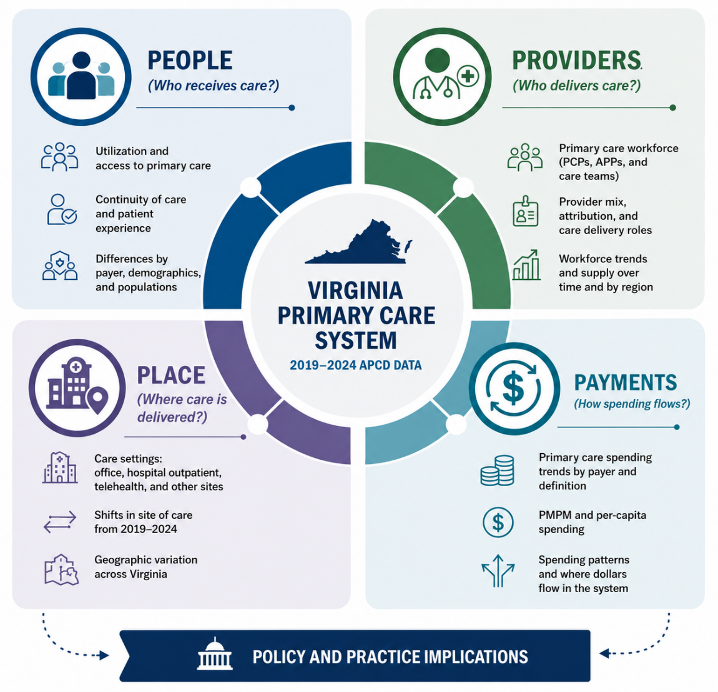
The 2026 edition of the Virginia Primary Care Investment Report expands upon prior reports to provide a more comprehensive assessment of primary care in the Commonwealth. Drawing on Virginia All-Payer Claims Database1 (APCD) data from 2019 through 2024, the report examines trends in primary care spending, utilization and continuity of care, workforce composition, and geographic variation across domains.
By exploring who receives primary care, who delivers it, where care is provided, and how spending and utilization patterns differ across payers and regions, the report offers decision-makers and other key partners a broader understanding of how primary care is financed, utilized, and delivered across Virginia’s healthcare system.
Executive Summary
Primary care is widely recognized as the foundation of a high-performing healthcare system. Strong primary care is associated with improved health outcomes, lower mortality, fewer avoidable hospitalizations, and lower overall healthcare costs. Yet despite its importance, policymakers have long raised concerns that primary care remains underfunded relative to other sectors of the healthcare system.
The 2026 Virginia Primary Care Investment Report examines how primary care is financed, utilized, and delivered across the Commonwealth using Virginia All-Payer Claims Database (APCD) data from 2019 through 2024. The report explores four key questions:
- How much is Virginia investing in primary care?
- Are Virginians receiving primary care?
- Who is delivering primary care?
- Where is primary care delivered?
Unless otherwise noted, findings emphasize the broad definition of primary care established by the Virginia Task Force on Primary Care, which captures physician services, advanced practice providers (i.e., nurse practitioners and physician associates), community-based clinics, and other settings involved in delivering primary care.
Key Findings
1. Primary care remained a small share of healthcare spending, even as enrollment grew substantially.
Between 2019 and 2024, the Virginia APCD captured an increase in average annual enrollment from approximately 5.1 million to 6.5 million covered members.
- After adjusting for inflation, total healthcare spending per member2 remained relatively stable, declining slightly from approximately $9,107 in 2019 to $8,931 in 2024.
- Broad primary care spending, which includes physicians, advanced practice providers, and community-based primary care settings, increased modestly from $316 to $348 per member per year.
- In contrast, spending on narrowly defined, physician-led primary care declined from $249 to $211 per member per year.
- Throughout the six-year period, primary care accounted for only 3.5% to 4.1% of total healthcare spending under the broad definition and 2.4% to 2.9% under the narrow definition, remaining below national benchmarks regardless of definition.
- Growth in primary care investment was concentrated within the broader primary care workforce and care delivery system rather than traditional physician-led primary care services.
2. Fewer Virginians are receiving primary care.
The share of Virginians receiving at least one primary care service declined from 71.9% in 2019 to 66.3% in 2024.
- Utilization declined across most age groups between 2019 and 2024, including among adults ages 65–79 (65.5% to 59.1%) and adults ages 80 and older (78.7% to 70.6%), although rates remained relatively high among older adults compared with younger populations.
- Children consistently had the highest rates of primary care use, with 85.6% of children and adolescents ages 0–18 receiving at least one primary care visit in 2024.
- Young adults had the lowest rates of primary care use, with 59.4% of adults ages 19–21 and 58.1% of adults ages 22–34 receiving primary care in 2024.
3. Primary care visit volume remained relatively constant.
Virginians received approximately 4.7 broad primary care visits per member per year in 2019 and 5.1 visits per member per year in 2024, despite substantial changes in enrollment and pandemic-related disruptions.
- Changes in utilization appear to be driven more by whether individuals accessed primary care at all than by large shifts in how frequently established patients received care.
4. Continuity of care weakened following the pandemic.
Among Virginians who used primary care, the percentage receiving at least 75% of their visits from the same clinician declined from 67.7% in 2019 to 60.8% in 2024.
- Although most Virginians who received primary care continued to receive the majority of their care from one clinician, continuity declined across every age group and has not returned to pre-pandemic levels.
5. Virginia’s primary care workforce is becoming increasingly multidisciplinary.
Family physicians remain central to primary care delivery throughout the study period. However, nurse practitioners account for a growing share of both spending and visits.
Between 2019 and 2024:
- The share of broad primary care visits delivered by nurse practitioners increased from 16.3% to 34.5%.
- Nurse practitioners grew from 15% to 35% of broad primary care spending, becoming the largest single clinician category by 2024.
- Family physicians continued to account for the largest share of visits but declined from 44.5% to 35.0% of total primary care visits (using the broad definition of primary care).
6. Primary care is delivered in more settings than the traditional physician office.
Office settings remained the predominant site of broad primary care delivery in 2024. However, the place-of-service codes recorded in claims data varied substantially across the lifespan reflecting differences in patient needs, clinical complexity, and models of care delivery.
Between 2019 and 2024:
- Children and younger adults primarily received primary care in office settings, while urgent care represented a growing share of visits among adults ages 19–34, accounting for approximately 10–12% of visits in 2024.
- Telehealth emerged as a lasting component of primary care delivery. Following a rapid expansion during the COVID-19 pandemic, telehealth utilization declined but remained well above pre-pandemic levels. In 2024, approximately 11% of primary care visits among adults ages 22–34 and 9% among adults ages 35–54 were delivered via telehealth, compared with approximately 2–3% among children and older adults.
- Among older adults, primary care visits were increasingly delivered in residential and facility-based settings. Nursing facility visits became more common with age, accounting for a larger share of primary care encounters among adults ages 80 years and older than among younger age groups.
- Hospital-based settings accounted for approximately 6% of primary care visits statewide and were used across all age groups.
These findings suggest that while office-based care remains the dominant model of primary care delivery in Virginia, primary care is increasingly delivered through a diverse mix of settings and modalities. Telehealth has become an established component of care delivery for many working age adults, while facility-based and other services play an increasingly important role in meeting the needs of older Virginians. Together, these patterns highlight the expanding range of environments in which primary care is delivered across the Commonwealth.
Note: Telehealth estimates should be interpreted cautiously, particularly during the early years of the COVID-19 pandemic, as coding practices and payer reporting requirements evolved substantially between 2020 and 2022.
Why Primary Care Matters
A substantial body of evidence demonstrates that high-quality primary care and well-functioning delivery systems are associated with improved population health outcomes, reduced mortality, fewer hospitalizations, and lower total healthcare spending.3 Achieving these outcomes depends on the presence of a strong primary care foundation that is accessible, continuous, comprehensive, well-coordinated, and accountable. These attributes are influenced by multiple system-level factors, including reimbursement structures, administrative requirements, workforce availability and distribution, care delivery infrastructure, integration of community-based services, and health information technology.4 Thus, payment models that support accessible, continuous, coordinated, and relationship-centered care are particularly important for ensuring long-term primary care capacity, sustainability, and equitable access across the Commonwealth.
Despite the well-established importance of primary care, these systems have historically faced underinvestment, workforce constraints, and other multilevel challenges.5 This context reinforces the need to examine not only total healthcare spending, but also the adequacy and distribution of investment in primary care across payers.
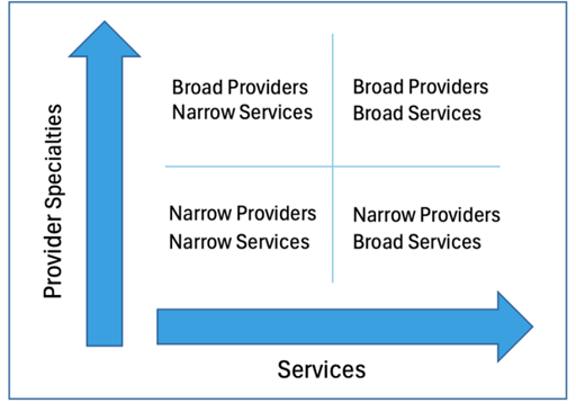
For the purposes of this and previous reports, the Virginia Task Force on Primary Care (VTFPC) established a four-quadrant approach to defining primary care based on a narrow and broad set of services and provider types.
Analyses were conducted using both a broad and a narrow definition of primary care services and providers, and a majority of the key findings reported below refer to the broadest definition of each.
- The narrow definition is based on physician-led preventive services.
- The broad definition includes all outpatient and professional services performed by primary care physicians, advanced practice practitioners (APPs), OBGYNs, School Health Clinics, Rural Health Centers, and Federally-Qualified Health Centers (FQHCs) (see Appendix A for additional detail).
Section 1. How Much Is Virginia Investing in Primary Care?
To understand how much Virginia is investing in primary care, this report measures spending on a per-member basis using average annual enrollment rather than relying solely on total healthcare expenditures, which can be influenced by changes in population size over time. Membership was calculated using total member months divided by 12, providing a more stable estimate of per-capita healthcare investment. All spending estimates presented in this section are adjusted to 2024 dollars to account for inflation and facilitate comparisons across years.
Between 2019 and 2024, Virginia’s average annual enrollment increased from approximately 5.1 million to 6.5 million members. After adjusting for inflation, total healthcare spending per member remained relatively stable, fluctuating between approximately $7,600 and $9,100 per year. Total spending declined during the first year of the COVID-19 pandemic, reaching $7,610 per member in 2020, before increasing steadily to $8,931 per member in 2024. These estimates are lower than national averages6, but the analyses were unable to capture all healthcare spending given data constraints.
Figure 1. Inflation-Adjusted Healthcare and Primary Care Spending Per Average Member Per Year, Virginia, 2019–2024
Note: Spending estimates are adjusted to 2024 dollars using the Consumer Price Index and are reported per average annual member (total member months divided by 12). Broad primary care includes physician primary care specialties, advanced practice providers, selected OB/GYN and internal medicine providers meeting preventive service thresholds, and community-based clinics. Narrow primary care is restricted to physician-led primary care services.
Primary care investment represented a comparatively small share of total healthcare spending throughout the six-year period. Under the broad definition of primary care, inflation-adjusted spending increased slightly from approximately $316 per member per year in 2019 to $348 in 2024. In contrast, narrowly defined primary care spending remained largely unchanged, declining from approximately $249 per member in 2019 to $211 per member in 2024, after adjusting for inflation. These findings suggest that although enrollment increased and healthcare spending fluctuated over time, relatively little additional investment flowed into traditionally defined physician-led primary care services.
Despite these differences in absolute spending, primary care consistently represented a relatively small proportion of total healthcare expenditures in Virginia. Broad primary care accounted for approximately 3.5% to 4.1% of total healthcare spending between 2019 and 2024, while the share attributable to narrow primary care declined modestly from 2.7% to 2.4%. Nationally, primary care spending has been estimated to range from approximately 4.5% to 5.3% of total healthcare expenditures using a narrow definition and from 11.6% to 12.0% using a broad definition. 7 Compared with these benchmarks, Virginia’s investment in primary care remains comparatively low regardless of definition.
Figure 2. Primary Care as a Percentage of Total Healthcare Spend, Virginia, 2019–2024
Note: Broad primary care includes physician primary care specialties, advanced practice practitioners (nurse practitioners and physician assistants8), selected OB/GYN and internal medicine providers meeting preventive service thresholds, and community-based clinics (FQHCs, RHCs, and school health centers). Narrow primary care is restricted to physician-led preventive and office-based outpatient services.
Per-member healthcare spending varied substantially across payer groups after adjusting for inflation. Medicare Advantage beneficiaries consistently had the highest annual healthcare spending, exceeding $15,000 per member throughout the six-year period and reaching approximately $16,019 per member in 2024. Medicare fee-for-service spending remained comparatively stable, declining from approximately $10,128 per member in 2019 to $8,210 in 2024. Commercial spending increased steadily from $6,140 to $7,026 per member, while Medicaid spending showed the greatest fluctuation, declining during the early pandemic years before increasing to approximately $9,459 per member in 2024. These differences likely reflect variation in age, health status, benefit design, enrollment composition, and patterns of healthcare utilization across payer populations.
Figure 3. Inflation-Adjusted Spending Per Year Per Average Member, 2019 vs. 2024
Patterns of primary care investment differed depending on how primary care was defined. Under the broad definition, inflation-adjusted primary care spending per member increased modestly across most payer groups, rising from $269 to $370 among commercially insured members, from $314 to $334 among Virginians with Medicaid, and remaining relatively stable among Medicare Advantage members at approximately $540 to $560 per member. In contrast, narrowly defined primary care spending was largely unchanged or declined over time. Narrow primary care spending decreased from $268 to $208 per member among Medicaid members, from $245 to $157 among Medicare fee-for-service members, and from $387 to $322 among Medicare Advantage members, while commercial spending remained relatively stable. Taken together, these findings suggest that although overall healthcare spending continued to increase, relatively little of that growth translated into greater investment in traditionally defined physician-led primary care services.
The relatively high Medicaid per member per year spending likely reflects a combination of the unique needs of Medicaid patients and changes associated with Medicaid expansion and continuous enrollment. However, the finding that Medicaid spending exceeds Medicare fee-for-service spending may also indicate incomplete capture of Medicare expenditures, particularly prescription drug spending, in the APCD. As a result, comparisons involving Medicare FFS should be interpreted cautiously.
Per-member healthcare spending increased substantially with age after adjusting for inflation, although the relationship was not strictly linear. In 2024 dollars, annual healthcare spending ranged from approximately $3,000 to $4,000 per member among children and young adults to more than $15,000 among adults aged 80 years and older.
Figure 4. Inflation-Adjusted Healthcare and Primary Care Spending Per Average Member by Age Group, Virginia, 2019 and 2024 (2024 Dollars)
The highest spending levels were consistently observed among adults aged 80 years and older, while adults aged 55–64 and 65–79 also experienced substantially higher spending than younger populations. These patterns likely reflect increasing clinical complexity, higher rates of chronic disease, and greater healthcare utilization as individuals age.
Primary care spending also varied across age groups, but the patterns differed depending on the definition used. Under the broad definition, inflation-adjusted primary care spending was highest among children and the oldest adults. Broad primary care spending ranged from approximately $416–$475 per member among children ages 0–18 years and $447–$472 per member among adults aged 80 years and older, compared with approximately $190–$350 per member among most adult age groups. Broad primary care spending generally increased modestly over time, particularly among middle-aged and older adults.
In contrast, narrowly defined primary care spending remained relatively stable throughout adulthood despite substantial differences in total healthcare expenditures. Among adults ages 19–79 years, narrow primary care spending generally ranged from approximately $100 to $220 per member per year in inflation-adjusted terms and changed little over time. Although adults aged 80 years and older consistently had the highest narrow primary care spending, increasing total healthcare expenditures among older adults far outpaced growth in narrowly defined primary care investment. As a result, the gap between broad and narrow primary care spending widened with age, suggesting that older Virginians increasingly rely on the broader primary care system, including advanced practice providers and a wider range of outpatient settings, to meet their healthcare needs.
Taken together, these findings suggest that Virginia’s investment in primary care remained modest despite substantial changes in enrollment and population needs between 2019 and 2024. After adjusting for inflation, total healthcare spending per member was relatively stable and slightly lower in 2024 than in 2019, while broad primary care spending increased modestly and narrowly defined physician-led primary care spending declined. Primary care continued to account for only a small share of total healthcare expenditures and remained below national benchmarks regardless of definition. Growth in primary care investment was concentrated within the broader primary care workforce, while investment in traditionally defined physician-led primary care remained flat or declined across several payer groups.
Section 2. Are Virginians Receiving Primary Care?
A key measure of primary care access is whether residents receive any primary care during the year. Primary care utilization in Virginia is assessed using claims-based measures of access, intensity, and continuity from 2019 to 2024. Unless otherwise noted, results are presented using the broad definition of primary care, which captures a wider set of clinicians and outpatient settings involved in delivering primary care services. Results using a narrower definition of primary care are provided in Appendix B as a sensitivity analysis.
This section examines three dimensions of primary care utilization: (1) access to primary care, measured by whether an individual receives at least one primary care service during the year; (2) intensity of use, measured by visit frequency among primary care users; and (3) continuity of care, measured by the concentration of visits with the same clinician over time.
Access to Primary Care
Between 2019 and 2024, the percentage of Virginians receiving at least one broadly defined primary care service annually declined from 71.9% to 66.3%. The largest decrease occurred in 2020, coinciding with disruptions associated with the COVID-19 pandemic. While utilization partially rebounded in 2021 and 2022, statewide access to primary care did not return to pre-pandemic levels by 2024.
Figure 5. Percent of Virginians With at Least One Broad Primary Care Visit Per Year, Virginia, 2019–2024
Note: Estimates are based on the broad definition of primary care and reflect the percentage of enrolled Virginians with at least one primary care visit during the calendar year.
Patterns of primary care use varied substantially by age. Children and adolescents consistently had the highest rates of primary care utilization, with approximately 86% of Virginians ages 0–18 receiving at least one primary care service in 2024. Utilization was lowest among young adults ages 19–34, where fewer than 60% received primary care in 2024. Primary care use generally increased again among middle-aged and older adults, with nearly 72% of adults ages 55–64 receiving care during the year.
Although utilization levels differ across age groups, most populations experienced declines in primary care use between 2019 and 2024. The largest reductions were observed among adults ages 65–79, whose utilization rate fell from 65.5% to 59.1%, and among adults ages 80 and older, whose utilization rate declined from 78.7% to 70.6%. In contrast, utilization among children remained comparatively stable throughout 2019-2024 despite pandemic-related disruptions. Payer-specific and county-level results are provided in Appendix C.
Figure 6. Percent of Virginians With at Least One Broadly Defined Primary Care Visit Per Year, by Age Group (2019-2024)
Frequency of Primary Care Access
While understanding whether Virginians receive primary care is important, it is equally important to understand how often they access these services. The frequency of primary care visits can provide additional insight into patient-clinician relationships and the structures in place to support preventive care, chronic disease management, and ongoing healthcare needs. Examining trends in visit frequency can help determine whether changes in primary care utilization are driven by more people entering the healthcare system, more frequent use among existing users, or both.
Statewide, broadly defined primary care utilization remained relatively stable between 2019 and 2024. Virginians received approximately 4.7 primary care visits per member in 2019, declining slightly to 4.5 visits per member in 2020 during the COVID-19 pandemic before recovering to 5.1 visits per member by 2024. During this period, the total number of broadly defined primary care visits increased from approximately 24.4 million to 32.8 million visits annually. However, because enrollment also increased over time, examining visits on a per-member basis provides a more meaningful assessment of utilization trends than total visit counts alone.
Figure 7. Broad Primary Care Visits per Average Member per Year, 2019-2024
Note: Visits per average member were calculated as the total number of broadly defined primary care visits divided by average annual enrollment (total member months divided by 12).
These findings build on the patterns observed in the previous section. Although the percentage of Virginians receiving at least one primary care service declined modestly following the pandemic, the overall intensity of primary care use remained relatively stable. Together, these trends suggest that changes in utilization over time were driven more by fluctuations in access to care than by large changes in the amount of care received by those already engaged with the primary care system.
Patterns of primary care utilization also varied considerably by age. Children and adolescents consistently had high levels of primary care use, averaging between 5.6 and 6.5 visits per member annually, likely reflecting preventive visits, immunizations, and routine pediatric care. Utilization was lowest among young adults ages 19 to 34, who received approximately 2.5 to 3.1 visits per member each year. Visit rates then increased steadily throughout middle adulthood and older age, reaching approximately 5.2 visits per member among adults aged 65 to 79 and 7.8 visits per member among adults aged 80 and older in 2024.
The age-related patterns observed here mirror those seen in primary care access. Young adults were both less likely to receive any primary care and received fewer visits overall, while children and older adults had the highest levels of utilization. These findings likely reflect differences in preventive care needs, chronic disease burden, and healthcare complexity across the lifespan.
Table 1. Broad Primary Care Visits Per Member Per Year by Age Group, Virginia, 2019–2024
Note: Visits per average member were calculated as the total number of broadly defined primary care visits divided by average annual enrollment (total member months divided by 12) within each age group.
Taken together, these findings suggest that primary care utilization in Virginia has remained relatively resilient despite disruptions associated with the COVID-19 pandemic and substantial changes in enrollment. While fewer Virginians accessed primary care in some years, those who remained engaged with the primary care system generally continued to receive care at similar rates. Primary care use follows a clear life-course pattern, with the greatest intensity observed among children and the oldest adults, underscoring the important role of primary care in both prevention and the ongoing management of complex health needs. Additional payer-specific and county-level results are provided in Appendix B.
Continuity of Primary Care
Beyond access and utilization, an important feature of a high-performing primary care system is continuity of care, or the extent to which patients receive care from the same clinician over time. Higher continuity has been associated with improved preventive care, better chronic disease management, fewer avoidable hospitalizations and emergency department visits, lower healthcare spending, and stronger patient-clinician relationships.9, 10, 11 When patients consistently see the same clinician, care may be better coordinated, decisions can be informed by a deeper understanding of patients’ medical histories, and trust can develop over time.
Unlike the preceding measures, which describe primary care use across the entire enrolled population, continuity is assessed only among individuals who received primary care during the year. In this report, continuity of care was measured as the percentage of broadly defined primary care users who received at least 75% of their primary care visits from the same clinician, identified using National Provider Identifiers (NPIs) in the APCD.12
Statewide, continuity of broadly defined primary care declined modestly between 2019 and 2024. In 2019, approximately 67.7% of Virginians who used primary care received at least 75% of their visits from the same clinician. By 2024, this figure had declined to 60.8%. The largest decrease occurred between 2020 and 2021, coinciding with disruptions associated with the COVID-19 pandemic. Following this decline, continuity stabilized at a lower level rather than returning to pre-pandemic rates.
Table 2. Percent of Broad Primary Care Users Receiving Most of Their Care From the Same Clinician, Virginia, 2019–2024
Note: Continuity was assessed among Virginians who received at least one broadly defined primary care visit during the calendar year. Individuals were classified as having high continuity if at least 75% of their broad primary care visits were delivered by the same clinician, identified using National Provider Identifiers (NPIs) in the APCD. This approach is a clinician-level adaptation of the Usual Provider Continuity (UPC) index commonly used in primary care research.
Patterns of continuity varied across the lifespan. Prior to the pandemic, adults ages 55–64 exhibited the highest continuity, with 73.0% receiving most of their primary care from the same clinician, followed closely by young adults ages 19–21 (72.3%). Children and adolescents and adults aged 80 years and older consistently exhibited lower levels of continuity. By 2024, continuity had declined across every age group, and fewer than two-thirds of all Virginians in all age categories received at least 75% of their care from the same clinician.
The largest declines in continuity occurred among middle-aged and older adults. Between 2019 and 2024, continuity decreased by nearly 10 percentage points among adults ages 55–64 (73.0% to 63.5%) and by approximately 9 percentage points among adults ages 35–54 (70.4% to 61.5%). Smaller declines were observed among children and adolescents, whose continuity fell from 62.9% to 59.9% during the same period. Adults ages 80 years and older experienced persistently lower continuity throughout the five-year period, declining from 64.4% in 2019 to 56.8% in 2024.
Figure 8. Broad Primary Care Continuity by Age Group, Virginia, 2019–2024
Note: Continuity was assessed among individuals who received at least one broadly defined primary care visit during the calendar year. High continuity was defined as receiving at least 75% of primary care visits from the same clinician.
These age-related patterns suggest that continuity of care is influenced by both healthcare needs and the organization of care delivery across the lifespan. Lower continuity among children may reflect the use of multiple clinicians within pediatric practices, while lower continuity among the oldest adults may reflect greater clinical complexity and the involvement of a broader range of clinicians in their care. The widespread declines observed following the pandemic may also reflect broader changes in primary care delivery, including workforce disruptions, increasing reliance on team-based models of care, and evolving patterns of healthcare utilization.
Geographic variation in continuity was also observed across Virginia counties (see Appendix B). However, these differences did not follow a clear urban-rural pattern. Counties with both high and low continuity were distributed throughout the Commonwealth, suggesting that local delivery system characteristics, such as workforce availability, practice organization, and patterns of care-seeking, may be more important drivers of continuity than geography alone.
Taken together, these findings suggest that although most Virginians who use primary care continue to receive the majority of their care from the same clinician, maintaining stable patient-clinician relationships has changed over time. Continuity declined across every age group following the COVID-19 pandemic and has not returned to pre-pandemic levels. As Virginia continues to strengthen its primary care system, preserving longitudinal relationships between patients and clinicians may represent an important component of improving care quality, coordination, and outcomes. Narrow continuity estimates and additional payer-specific analyses are provided in Appendix B.
Section 3. Who is Delivering Primary Care?
Primary care in Virginia is delivered by a diverse mix of clinicians, including physicians, nurse practitioners, physician assistants, and other specialties practicing in outpatient settings across the Commonwealth. Understanding who delivers primary care is important for workforce planning, access to care, and the development of policies intended to strengthen the primary care system. This section examines changes in the composition of Virginia’s primary care workforce between 2019 and 2024 using broadly defined primary care spending and utilization.
Primary Care Clinician Types
Broad primary care spending remained concentrated among a relatively small number of clinician types, although the composition of the workforce shifted substantially over time. In 2019, family physicians accounted for the largest share of broad primary care spending, representing approximately 40% of total spending, followed by pediatricians (27%) and nurse practitioners (15%). By 2024, nurse practitioners had become the single largest clinician category, accounting for approximately 35% of broad primary care spending and surpassing family practice, which declined to 32% of total spending. Pediatric medicine remained a major component of Virginia’s primary care workforce, accounting for approximately 20% of broad primary care spending in 2024, although its share declined modestly over the six-year period.
Figure 9. Percent of Broad Primary Care Spending by Clinician Type, Virginia, 2019–2024
These trends suggest that Virginia’s primary care system increasingly relies on a multidisciplinary workforce rather than traditional physician specialties alone. While family physicians remain central to the delivery of primary care services, nurse practitioners account for a growing proportion of primary care activity and investment. Smaller specialties, including internal medicine, obstetrics and gynecology, geriatric medicine, general practice, and physician assistants, collectively represented a relatively stable share of primary care spending throughout the five-year period.
Primary Care Workforce Over Time
Broad primary care visit patterns show a similar shift in workforce composition. Family practice remained the largest clinician category throughout 2019-2024, but its share of broad primary care visits declined from 44.5% in 2019 to 35.0% in 2024. Over the same period, nurse practitioners increased from 16.3% to 34.5% of visits, nearly matching family practice by 2024.
Pediatric medicine continued to account for a substantial share of broad primary care visits, though its share declined from 22.5% in 2019 to 18.1% in 2024. Internal medicine also declined as a share of visits, from 11.8% to 8.1%. Other clinician types, including OB/GYN, general practice, geriatric medicine, and physician assistants, accounted for smaller shares of total visit volume.
Taken together, the spending and visit data suggest that Virginia’s primary care workforce is becoming increasingly multidisciplinary. Nurse practitioners now account for a much larger share of both primary care spending and visits than they did in 2019, while family practice and pediatric medicine continue to play central roles in primary care delivery.
Geographic Variation in Workforce Composition
The composition of Virginia’s primary care workforce varies substantially across communities. In 2024, advanced practice providers accounted for between approximately 15% and 68% of broadly defined primary care visits across Virginia counties.
Figure 10. APP Share of Broad Primary Care Visits by Locality, 2024
Counties in Southwest and Southside Virginia generally exhibited the highest reliance on APPs. In several localities, including Dickenson County, Galax City, Grayson County, and Tazewell County, APPs delivered more than 60% of broadly defined primary care visits. By contrast, many Northern Virginia localities, including Fairfax, Loudoun, Arlington, and Prince William, relied less heavily on APPs, with APPs accounting for approximately one-quarter of primary care visits.
These patterns suggest that there is no single model of primary care delivery across the Commonwealth. Communities may adapt their workforce differently based on local clinician supply, practice organization, and population needs. In areas facing physician shortages or limited access to traditional primary care specialties, APPs may play an especially important role in maintaining access to primary care services.
Virginia’s primary care workforce is becoming increasingly multidisciplinary, with nurse practitioners playing a rapidly expanding role in delivering care.
Section 4. Where is Primary Care Delivered?
Primary care in Virginia is delivered by a diverse mix of clinicians, including physicians, nurse practitioners, physician assistants, and other specialties practicing in outpatient settings across the Commonwealth. Understanding who delivers primary care is important for workforce planning, access to care, and the development of policies intended to strengthen the primary care system. This section examines changes in the composition of Virginia’s primary care workforce between 2019 and 2024 using broadly defined primary care spending and utilization.
Primary Care Settings
Primary care is delivered across a range of settings in Virginia, reflecting differences in patient needs, clinical complexity, and evolving models of care delivery. While primary care is often thought of as occurring in traditional physician offices, broadly defined primary care includes services delivered by primary care physicians, advanced practice practitioners, OB/GYNs, Federally Qualified Health Centers (FQHCs), Rural Health Clinics (RHCs), and other outpatient settings involved in the provision of primary care. Examining where care is delivered provides insight into how Virginia’s primary care system is organized and how delivery patterns vary across populations.
Interpretation of home-based place-of-service codes among older adults warrants caution because place-of-service coding patterns in Medicare fee-for-service claims differed substantially from those observed in other payer types.
Figure 11. Where Virginians Receive Broad Primary Care Across the Lifespan, Virginia, 2024
Note: Percentages represent the distribution of broad primary care visits within each age group and sum to approximately 100% due to rounding. Broad primary care includes physician primary care specialties, advanced practice providers, FQHCs, RHCs, and other community-based primary care settings.
*Other settings include retail clinics, public health clinics, residential care settings, mobile units, and other care sites.
The settings in which Virginians receive primary care differ substantially across the lifespan. Among children and adolescents, primary care remained overwhelmingly office based. In 2024, approximately 82% of visits among individuals aged 0–18 years occurred in office settings, with hospital-based settings accounting for 8.9% of visits and urgent care facilities accounting for 6.0%.
Young adults relied on a somewhat broader mix of settings. Among individuals aged 19–21 years, nearly 12% of primary care visits occurred in urgent care settings in 2024, compared with approximately 10% among adults aged 22–34 years. These findings may reflect greater reliance on convenient, episodic sources of care among younger populations.
For middle-aged adults, office-based care remained dominant, although hospital-based and urgent care settings accounted for a modest share of visits. By 2024, approximately 72% of visits among adults aged 35–54 years and 71% among adults aged 55–64 years occurred in office settings.
Among older adults, primary care was more likely to be delivered in residential and facility-based settings. Nursing facility visits accounted for a growing share of primary care encounters with advancing age, representing 4.7% of visits among adults ages 65–79 and 7.8% among adults ages 80 years and older in 2024. Differences in place-of-service coding among Medicare fee-for-service claims make it difficult to draw firm conclusions about the use of home-based settings, but the findings suggest that older adults receive care across a broader range of settings than younger Virginians.
Telehealth as a Primary Care Delivery Modality
The COVID-19 pandemic accelerated the adoption of telehealth across all age groups, although utilization patterns differed substantially by age. Prior to 2020, telehealth accounted for less than 1% of broad primary care visits across all age groups. During the first year of the pandemic, telehealth use increased dramatically, reaching approximately 5% to 13% of broad primary care visits depending on age. It is important to note, however, that telehealth coding practices changed substantially during the COVID-19 pandemic, and coding consistency likely fluctuated and ultimately improved over time. As a result, estimates prior to 2022 should be interpreted cautiously and may not fully capture all telehealth services delivered during the early stages of the pandemic.
Telehealth utilization declined following its 2020 peak but remained well above pre-pandemic levels through 2024, suggesting that virtual care has become an enduring component of Virginia’s primary care system rather than a temporary pandemic response. In 2024, telehealth accounted for approximately 10.7% of broad primary care visits among adults ages 22–34 years and 8.5% among adults ages 35–54 years, compared with 2.1% among children and adolescents and 2.6% to 3.2% among adults aged 65 years and older.
Table 3. Share of Broad Primary Care Visits Delivered via Telehealth, by Age Group, Virginia, 2019, 2020, and 2024
Note: Telehealth visits were identified using place-of-service codes (POS 02 and POS 10). Percentages represent the share of broad primary care visits delivered via telehealth within each age group.
These findings indicate that telehealth adoption has been greatest among working-age adults, who may benefit most from the convenience and flexibility offered by virtual care. In contrast, children and older adults relied less heavily on telehealth. Notably, despite the increasing prevalence of home-based primary care among older adults, telehealth represented a relatively small share of visits among individuals aged 65 years and older, suggesting that much of the growth in home-based care reflects in-person services delivered in the home rather than virtual encounters.
These age-related differences suggest that the location and modality of primary care delivery reflect differing clinical needs across populations. Younger Virginians continue to rely primarily on office-based care, although telehealth and urgent care have become increasingly common sources of care among working-age adults. In contrast, older adults increasingly receive primary care in home and long-term care settings, with relatively limited reliance on telehealth. Together, these findings underscore that there is no single model of primary care delivery in Virginia. Rather, primary care is delivered through a diverse set of clinicians, settings, and modalities that continue to evolve in response to patient needs and changing models of care.
Section 5. Conclusions and Future Directions
Primary care in Virginia is evolving.
Between 2019 and 2024, the Commonwealth experienced enrollment growth, disruption associated with the COVID-19 pandemic, rising healthcare costs, and continued changes in how primary care is organized and delivered. Despite these shifts, primary care remained a relatively small share of total healthcare spending and continued to fall below national benchmarks regardless of how it was defined.
At the same time, this report suggests that Virginians increasingly rely on a broader model of primary care. Broadly defined primary care spending, which includes advanced practice providers and community-based settings, increased modestly over time, while investment in more traditional physician-led, office-based primary care remained largely unchanged after adjusting for inflation. Family physicians continue to play a central role in delivering care, but nurse practitioners and other members of the primary care team account for a growing share of visits and spending.
The findings also point to important challenges. Fewer Virginians received primary care in 2024 than before the pandemic, and continuity of care declined across every age group. Although office-based care remains the predominant setting for primary care delivery, claims increasingly reflect care delivered in the home, nursing facility, urgent care, and other settings, particularly among older adults with more complex healthcare needs.
As Virginia’s population ages and the healthcare landscape continues to evolve, monitoring these trends will remain critical. Future policy discussions should consider not only how much the Commonwealth invests in primary care, but also who receives care, who delivers it, where it is delivered, and whether those investments support access, continuity, and high-quality care for all Virginians. Primary care represents a small fraction of healthcare spending, yet it remains one of the healthcare system’s most important foundations. Ensuring that this foundation remains strong will be essential to improving health and shaping the future of healthcare in Virginia.
Footnotes
[1] The Virginia All-Payer Claims Database (APCD) does not include claims from self-insured plans governed by ERISA, federal employee health benefits, military/TRICARE plans, or self-pay. It includes approximately two-thirds of all Virginians, and pharmaceutical spend information is incomplete. All dollar amounts have been adjusted for inflation using the Bureau of Labor Statistics 2024 CPI Inflation Calculator. [Return to text]
[2] The Virginia All-Payer Claims Database (APCD) does not include claims from self-insured plans governed by ERISA, federal employee health benefits, military/TRICARE plans, or self-pay. It includes approximately two-thirds of all Virginians, and pharmaceutical spend information is incomplete. All dollar amounts have been adjusted for inflation using the Bureau of Labor Statistics 2024 CPI Inflation Calculator. Membership was calculated as an average using total member months divided by 12, providing a more stable estimate of per-capita healthcare investment. [Return to text]
[3] National Academies of Sciences, Engineering, and Medicine. 2021. Implementing high-quality primary care: Rebuilding the foundation of health care. Washington, DC: The National Academies Press. https://doi.org/10.17226/25983. [Return to text]
[4] Ibid. [Return to text]
[5] Martin, S., Phillips, R. L., Jr, Petterson, S., Levin, Z., & Bazemore, A. W (2020). Primary Care Spending in the United States, 2002-2016. JAMA Internal Medicine, 180(7), 1019–1020.https://doi.org/10.1001/jamainternmed.2020.1360. [Return to text]
[7] The narrow and broad definitions for national benchmarks follow the definitions set by the Milbank Memorial Fund in their annual scorecard. These differ from the VTFPC definitions presented above. National estimates are derived from data from Agency for Healthcare Research and Quality Medical Expenditure Panel Survey (2010-2023). https://www.milbank.org/primary-care-scorecard/. [Return to text]
[8] The profession is increasingly referred to as “physician associate”, although source data and cited workforce datasets continue to use the term physician assistant (PA). [Return to text]
[9] Gray DJP, Sidaway-Lee K, White E, Thorne A, Evans PH. Continuity of care with doctors – a matter of life and death? A systematic review of continuity of care and mortality. BMJ Open. 2018;8(6):1–12. [Return to text]
[10] Barker I, Steventon A, Deeny SR. Association between continuity of care in general practice and hospital admissions for ambulatory care sensitive conditions: cross sectional study of routinely collected, person level data. BMJ Online. 2017;356. [Return to text]
[11] Bazemore A, Merenstein Z, Handler L, Saultz JW. The impact of interpersonal continuity of primary care on health care costs and use: a critical review. Ann Fam Med. 2023;21(3):274–9. [Return to text]
[12] Bice, T.W. and Boxerman S.B. (1977). A quantitative measure of continuity of care. Medical Care, 15(4):347–349. [Return to text]
Appendices