Past Year Health Value Dashboards
2024 DASHBOARD
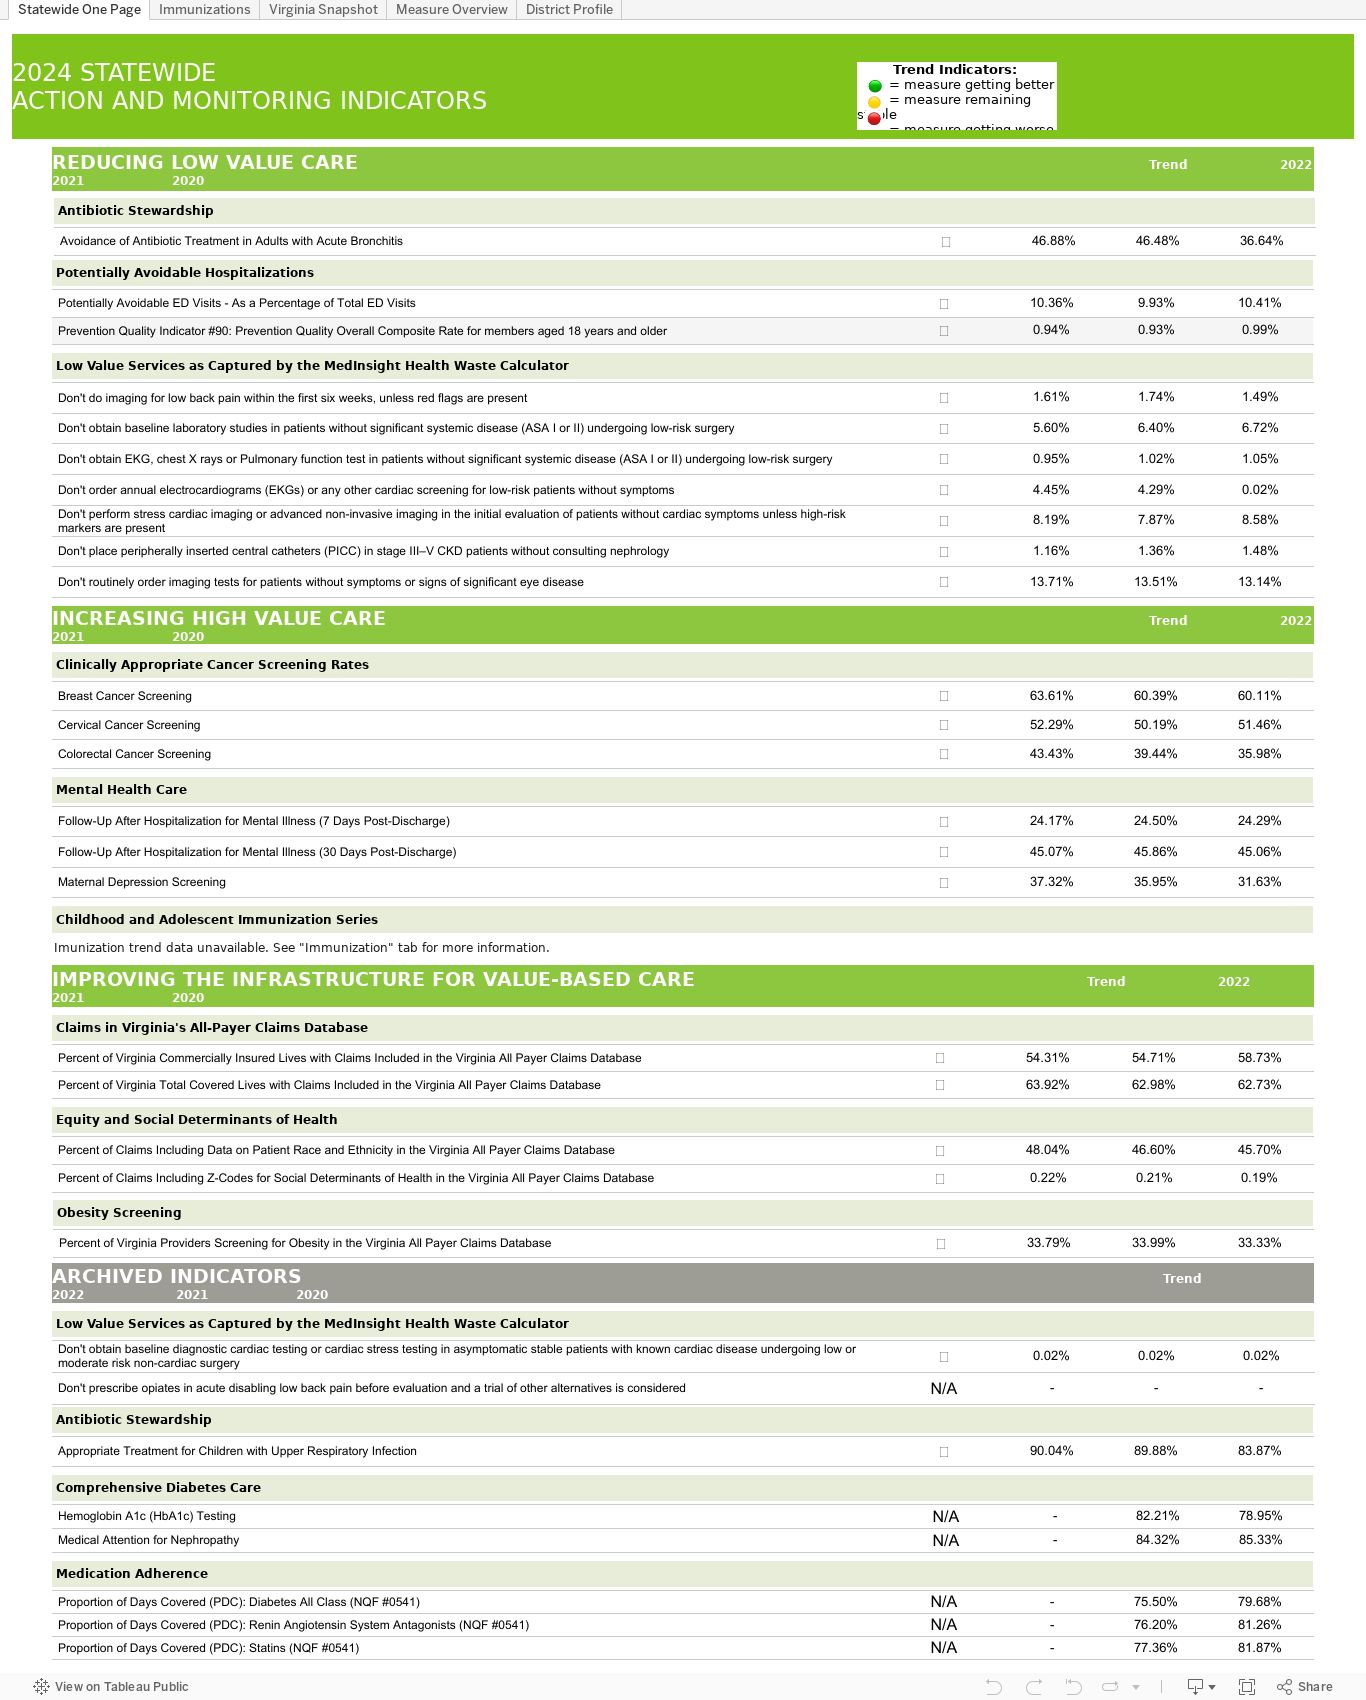
The 2024 dashboard is based on dates of service for calendar years (CY) 2020-2022.
Data for all measures were obtained from the All-Payer Claims Database (APCD) except for Prevention Quality Indicator #90: Prevention Quality Overall Composite Rate (obtained from Virginia Patient Level Data System) and Improving Infrastructure for Value-Based Care measures under the ‘Claims in Virginia’s All-Payer Claims Database’ sub-category, which use a denominator obtained from the Kaiser Family Foundation.
All vaccination, cancer screening and diabetes care measures were created using Milliman Evidence Based Measures (EBM) version 2024C with measure end dates of 2020-12, 2021-12, and 2022-12.
All Low Value Services as captured by the MedInsight Health Waste Calculator measures were created using software version 8.
Area Deprivation Index (ADI) is based on a measure created by the Health Resources & Services Administration (HRSA) over two decades ago for primarily county-level use, but refined, adapted, and validated to the Census block group/neighborhood level by Amy Kind, MD, PhD and her research team at the University of Wisconsin-Madison. It allows for rankings of neighborhoods by socioeconomic disadvantage in a region of interest (e.g. at the state or national level). It includes factors for the theoretical domains of income, education, employment, and housing quality. It can be used to inform health delivery and policy, especially for the most disadvantaged neighborhood groups. More information on the ADI- https://www.neighborhoodatlas.medicine.wisc.edu/
Composite Ranking- Average ranking across all measures out of the 35 Virginia local health districts.
2023 DASHBOARD